
01 / WHAT JSON MAKES COMPARISON HARD
What JSON makes easy to store, it makes hard to compare.
Nested records are fine to read and useless to compare. The moment you need to know which of four hundred records is missing a field, you need columns, not trees. Jsonflat pulls nested records into a flat table — one column per dotted path, one row per record — so you can open the data in any spreadsheet and see, in seconds, what is present and what is not.
02 / WHAT NESTING HIDES, FLATTENING REVEALS
A single dotted path per leaf, one column per path, one row per record.
Every JSON leaf value — every string, number, boolean, or null — gets a single column named by its full path from the root. Missing fields become empty cells, visible instantly rather than discovered by scrolling. Arrays are either indexed (tags[0], tags[1]) or exploded into additional rows.
03 / FOUR OPERATIONS, ONE SURFACE
The tool does not guess, decorate, or upload your data.
- Paste any valid JSON
- From an API console, a curl response, a log file, or any text editor. The whole transformation runs in the browser. Nothing touches a server.
- Flatten to one column per leaf
- Every leaf value gets a column named by its dotted path (
a.b.c). Mixed structures work — missing fields show as empty cells, not errors. - Choose your array handling
- Explode arrays into additional rows or index them into columns (
items[0].name,items[1].name). Switch modes without re-pasting. - See what is missing, at a glance
- Every column header carries a coverage badge showing how many records carry that field. 397 / 400 tells you three records are missing it, before you notice manually.
- Export without friction
- Download as RFC 4180 CSV with UTF-8 BOM (Excel-ready). Copy as tab-separated values to paste directly into a spreadsheet.
04 / WHAT IT COSTS
The tool is free and always will be.
Jsonflat runs entirely in your browser. There is no server, no account, no subscription, and no data ever leaves your machine.
05 / WHAT IT WILL NOT DO
Honest about limits.
Every tool has boundaries. These are stated here so you do not discover them by surprise.
- No URL fetching
- Jsonflat does not fetch a URL for you. Paste the JSON content directly into the textarea. (Your browser will not let a page read another origin's data anyway — this is a platform rule, not a product choice.)
- No large-document streaming
- Documents larger than your browser can hold in memory will be rejected with a message stating the limit, not truncated silently. The maximum input size is 5 MB; the maximum rendered cells is 100,000.
- No type inference
- Jsonflat reports values as JSON states them. A string that looks like a number stays a string. No guessing, no "smart" conversion.
- No server-side persistence
- Your data is not uploaded or stored on any server. A history of your recent flattens is saved in your browser (localStorage) so you can reload past conversions; this data never leaves your machine. Nothing is shared across devices or users.
- No email, no notifications
- Nothing is emailed, scheduled, or sent. The tool has no sender, no SMTP, and no notification system.
06 / WHAT A RESULT LOOKS LIKE
A skeptic asks: "Why not just write a script?"
Because you would write it, run it once, throw it away, and write it again next month. Jsonflat is the script you do not write — it handles mixed structures, missing fields, nested arrays, and column alignment without you thinking about edge cases. The output is a table you can paste into a ticket, a spreadsheet, or a comparison tool immediately.
07 / THE TOOL IS OPEN AND READY
No install. No sign-up. Paste and flatten.
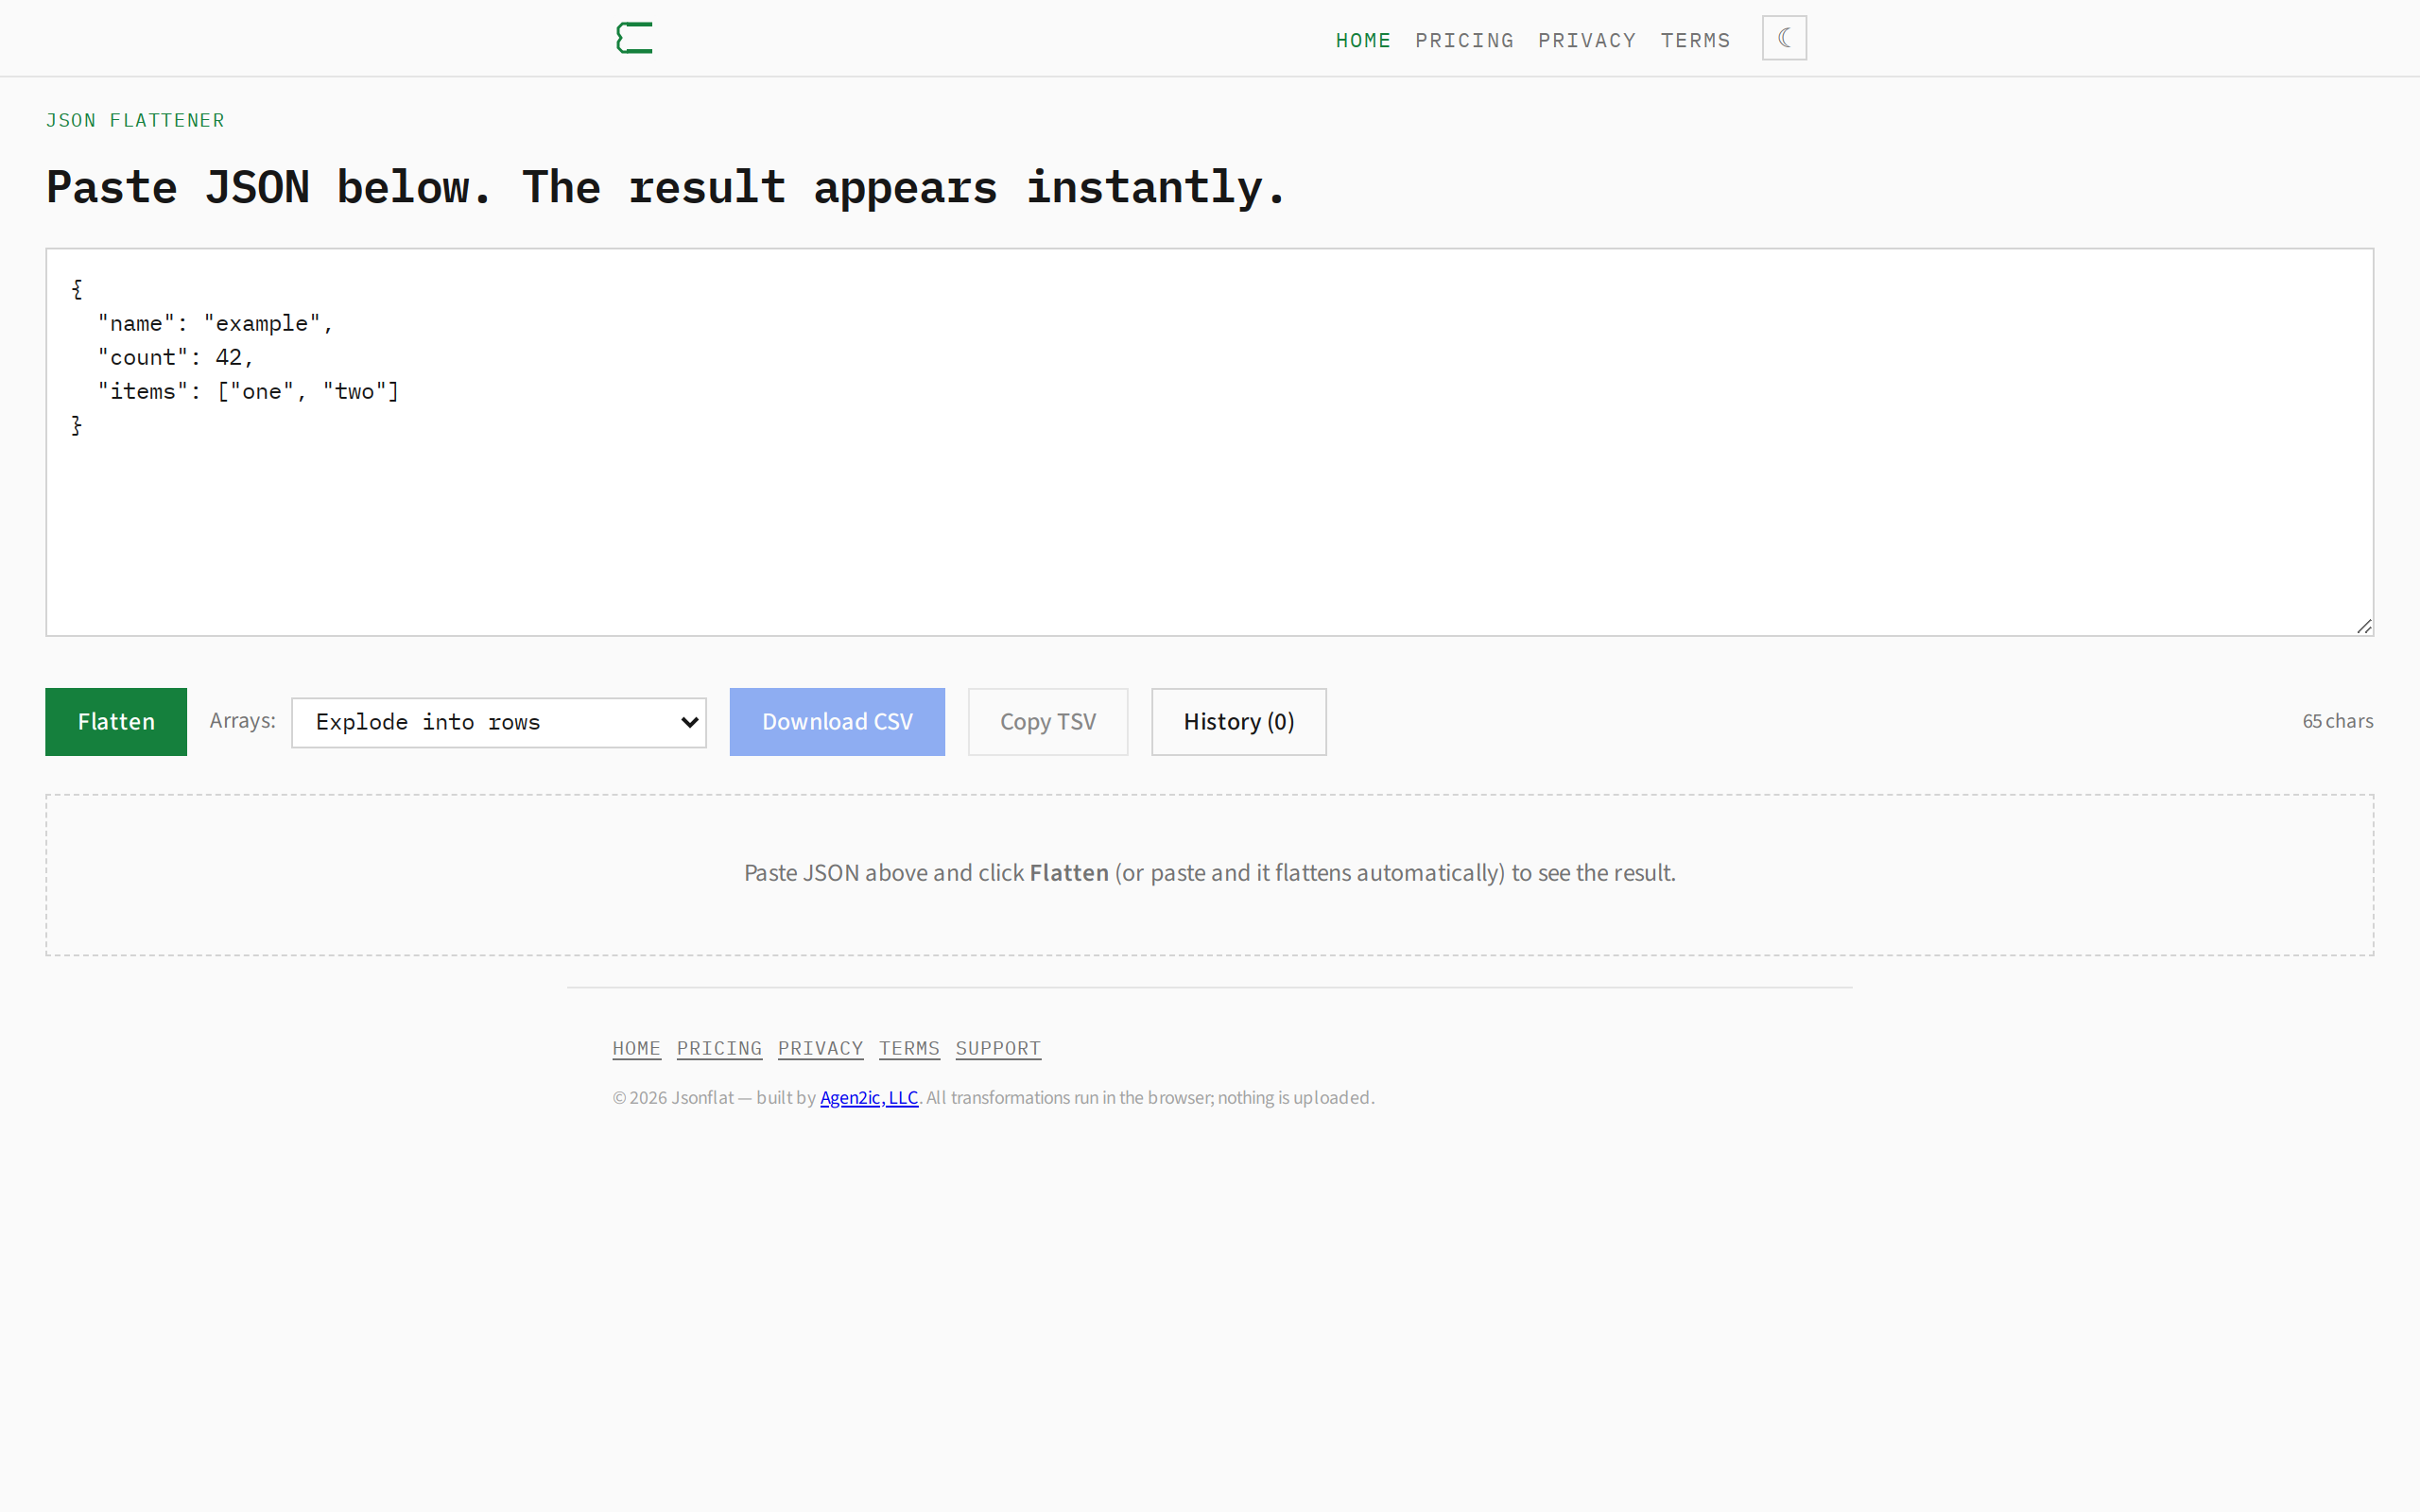
The tool page is a single textarea, a dropdown for array handling, and a table. Paste your JSON, choose your mode, and see the result. That is the whole surface.